Sometimes, reading a knitting chart can be like trying to read computer code. However, once you know the basics of reading knitting charts; it opens up your knitting world.
Advantages to Knitting Charts
- See at a glance what the knitting should look like.
- Check what the stitch should be on the row before to keep on track.
- Far easier to modify.
- Quicker to memorise the stitch pattern.
- More compact instructions.
- Works better for visual learners.
Basics of Knitting Charts
A knitting chart is a way to visually represent what you are knitting. This means that you use them differently depending on whether you are knitting in the round or flat. Hopefully, the pattern should tell you this. However, if it doesn’t, another way to check is to see where the numbers on the chart are. However, some designers don’t do this, so just double check first.
- When working in the round, all the consecutive numbers should be on the right-hand side.
- When working flat, the numbers will alternate from right to left.
Each stitch is represented by a symbol that should look like something similar to the finished results. This allows you to look at the chart at a glance and have a good understanding of how it looks.
Different designers do use different symbols though, so double check the key for their meanings.
Each square on the chart represents a different stitch. The basic principle for using a chart is to just work each square in order on your knitting.
Knitting Flat
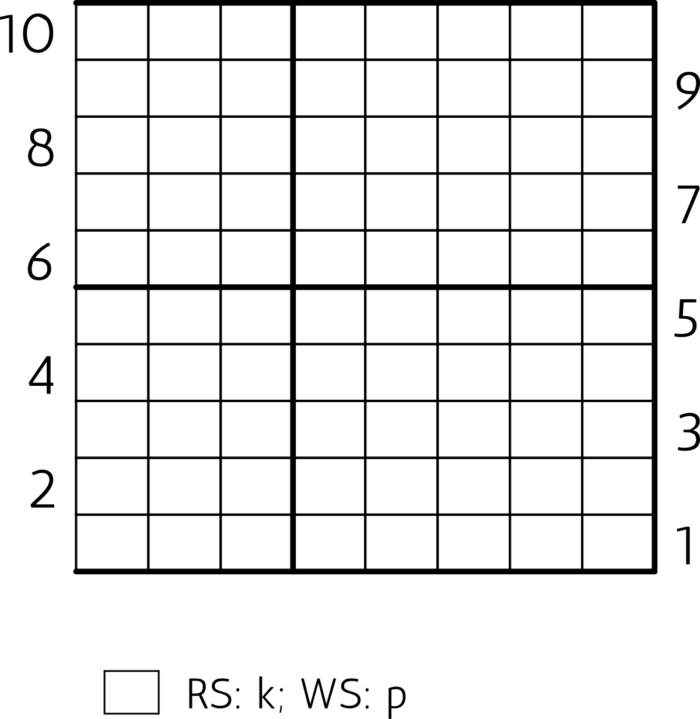
When working flat, start at Row 1 (this will most likely be on the right) and read each stitch from right to left across the row.
Row 2 will start at the other end (as that is where you’ve knit to). Read Row 2 from left to right.
The traditional way to write patterns means that the symbols represent what the stitch looks like on the right side (so the chart clearly represents the knitting). This means that most stitches will have a different instruction for the wrong side (WS) e.g. knit on the right side will be purl on the wrong side. These instructions should be listed clearly in the key.
This chart is stocking stitch worked flat. Notice that the key shows the blank square is knit on the right side and purl on the wrong side.
Summing Up
- Read right side rows from right to left.
- Read wrong side rows from left to right.
- Symbols have different meanings on the wrong side.
Knitting in the Round
Using charts in the round is easier. Since you are working in a circle, you’re only knitting on the right side.
This means that every round is worked right to left.
This chart produces exactly the same fabric as the one worked flat but you are working knit stitches only and every round is read from right to left.
Summing Up
- Work every round from right to left.
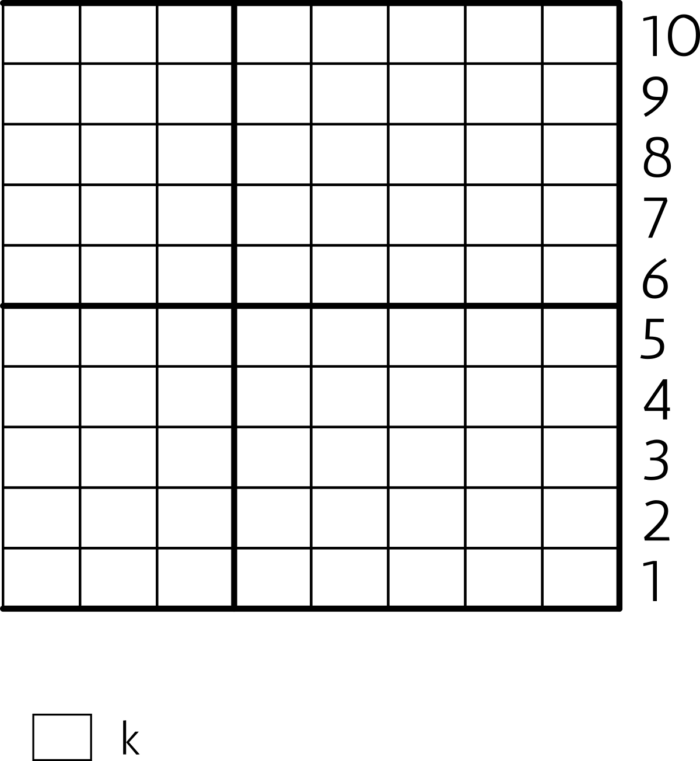
No Stitches
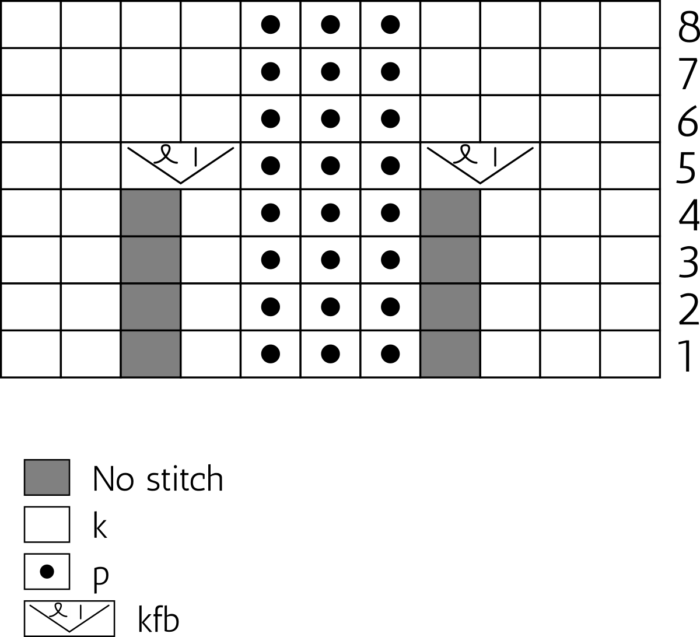
When stitch counts change in knitting this could throw out the chart, so to keep the stitches lined up correctly to represent the knitting, there are squares called no stitches.
This can be represented in two ways – visible and invisible.
Visible No Stitch
The invisible no stitch is often represented as a grey square; though, you might see it as a cross too.
The simple rule is when you see a no stitch, completely ignore it. You don’t need to count it. Skip past it to the next square. It doesn’t represent a stitch, it’s just there to line up the chart.
Example: the written instructions for Round 1 would be k3, p3, k3. The grey no stitch squares have been ignored.
Invisible No Stitch
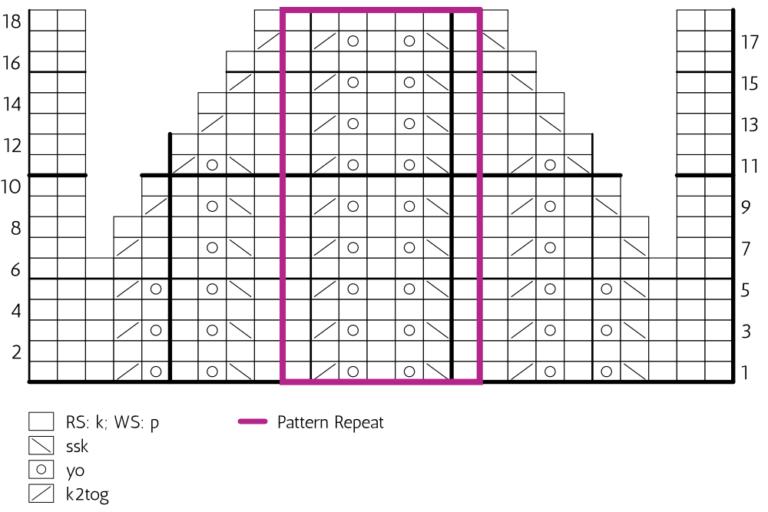
The invisible no stitch is often used when there is only decreasing on the chart. Basically, the squares disappear from the chart as the stitches are decreased. Sometimes, this means there is a gap between one part of the chart and the next. Just ignore this gap and continue to the next lot of stitches on the same row/round.
Pattern Repeats
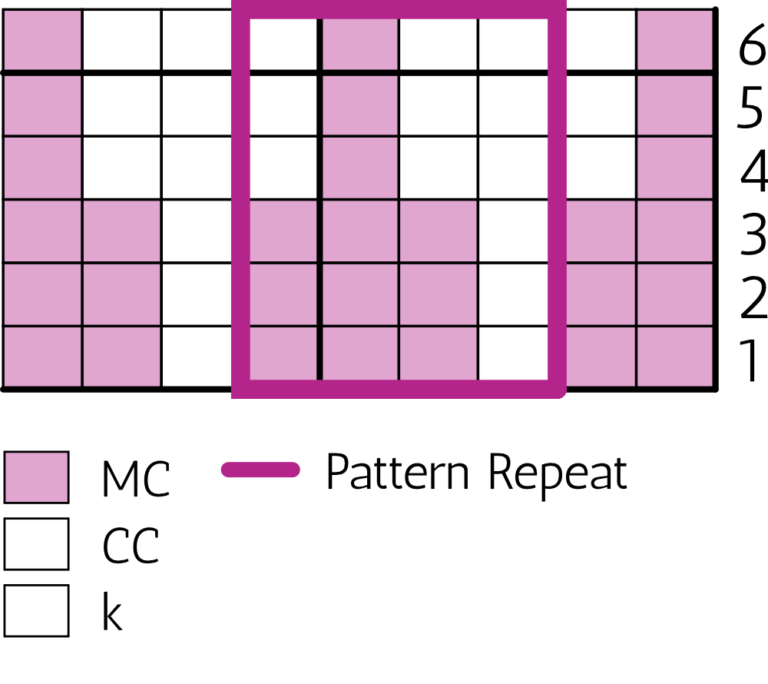
In written instructions, you’ll probably see the instructions telling you to *k2, p2, rep from * or maybe (k2, p2) across. In charts, this repeating of instructions is represented by the pattern repeat border.
This will be a coloured/emboldened line around some stitches. This means that you work the stitches as instructed up to the line, continue across until you reach the other line and then start again at the first line. You continue repeating these stitches until the number of stitches left on the chart, after the line, and then work these final stitches on the chart.
Example: In the chart above, for Row 1, repeat the stitches within the border until there are 9 stitches left and then work the final 9 stitches of the chart.
Colour and Charts
Colour is used in charts for several different reasons. The most common use is to represent different colours of yarn. In this chart, there is a simple colourwork pattern worked in two colours.
You can see by the number position that it is worked in the round. All the stitches are knit stitches but some are worked in the main colour (MC) and others are worked in contrast colour (CC).
Colourwork charts can be much easier to use than written instructions, as you can check the previous row/round for your position. For example, Round 4, you can quickly see that the single MC stitch is positioned in the centre of the 3 MC stitches from the previous round. This means that you don’t necessarily have to read every single stitch and you should be able to notice if you’re off quite quickly.
Colour can sometimes be used in other ways, such as pattern repeats or to represent RS and WS rows. However, the pattern should explain if this has been done.
